

Farmville – Let’s say that you’re doing a little self-scouting over the summer in preparation for free agency, the draft, and possible trades. So you create a heat-map of your roster to find out where your strengths and weaknesses are in terms of dynasty ranking. It looks cool! THEN you get the bright idea to heat-map your opponents’ starting lineups to find out where their strengths and weaknesses lie so you can find ideal trade opportunities. It looks the figure below.
Two quick notes:
1) these are dynasty rankings from dynastyleaguefootball.com with the exception of DT (I used pff.com since dynastyleaguefootball didn’t split out DE and DT) and CB because literally no one knows/cares about CB.
2) I put in the highest ranked fantasy player as “starter”. This won’t always be who you actually start, though. For example, I’m much more likely to start Keenan Allen in my Flex 2 spot than Rashod Bateman, but Bateman as a higher dynasty rank at this point of their careers.
Click on the image to check out the full Google Doc. Does this visual change your perception of your team or give you ideas of moves to make?
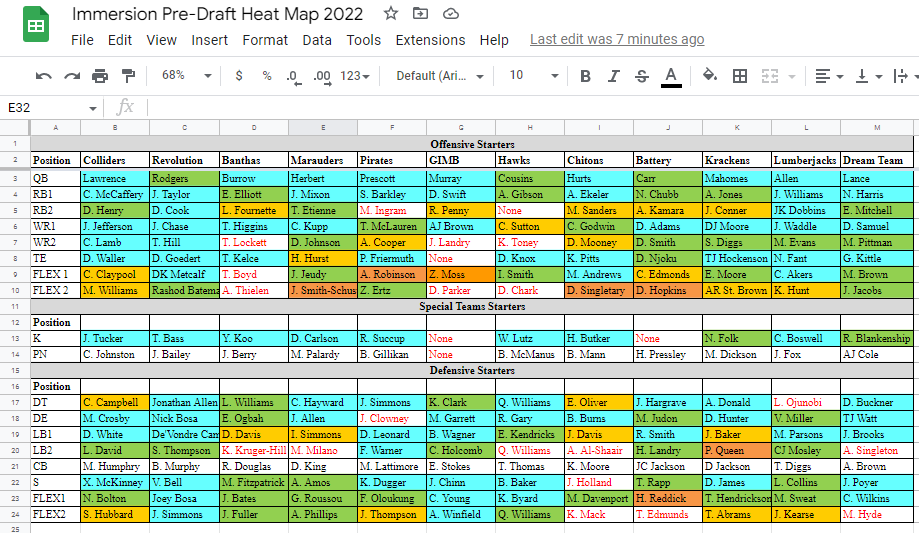
KEY
Teal = Positional Rank 1-12
Green = Positional Rank 13-24
Yellow/Orange = Pos Rank 25-36
Burnt Orange = Pos Rank 37-48
Red Text = Need to imporve
© 2022, Adam Franssen. All rights reserved.
Love the teal as it’s the Colliders’ secondary color. Don’t love my DT situation, but then again I never do.
Nice! Now do it again with a website that makes my team look really good.
I’m just curious about Adam’s aggressive addition of the “c” to the name Krakens. I’ve seen it too many times to write it off as a typo. There’s some deep-seated hostility there.
I have a subscription to Rotowire, and they do a Power Ranking where the number one team gets a score of 100. Just for funsies, here is what they have us at right now, before the draft:
1) Fransburg – 100
2) Batavia – 99.63
3) Bestine – 86.39
4) Oregon – 86.11
5) Linn County – 85.77
6) Madtown – 82.79
7) North Point – 81.84
8) Culver City – 81.77
9) Marshfield – 69.84
10) Cleveland – 67.88
11) Holley – 51.8
12) Tooz Town – 45.71
Ouch! Pirates will hopefully find a way to be good!
Update after 1st round of draft:
1) Batavia – 100 (+1)
2) Fransburg – 99.84 (-1)
3) Oregon – 86.84 (+1)
4) Madtown – 86.32 (+2)
5) Bestine – 85.78 (-2)
6) Linn County 85.31 (-1)
7) Culver City 83.95 (+1)
8) North Point 83.27 (-1)
9) Marshfield 77.99 (+0)
10) Holley 69.44 (+1)
11) Cleveland 62.65 (-1)
12) Tooz Town 46.45 (+0)
Update after the Immersion Draft:
1) Batavia 100 (+0)
2) Fransburg 99.46 (+0)
3) Culver City 88.13 (+4)
4) Oregon 87.08 (-1)
5) Madtown 86.61 (-1)
6) Bestine 86.41 (-1)
7) Linn County 84.07 (-1)
8) Marshfield 79.29 (+1)
9) North Point 79.18 (-1)
10) Cleveland 72.01 (+1)
11) Holley 69.32 (-1)
12) Tooz Town 46.26 (+0)
Rotowire loved the Krakens draft!